

- Usage Analytics dashboards - these are dashboards created by Lightdash which give you an overview of your project’s content and user activity.
- Query tags - this is metadata which is added to your data warehouse queries and gives you information about who is querying data and what they are querying.
Usage analytics dashboards
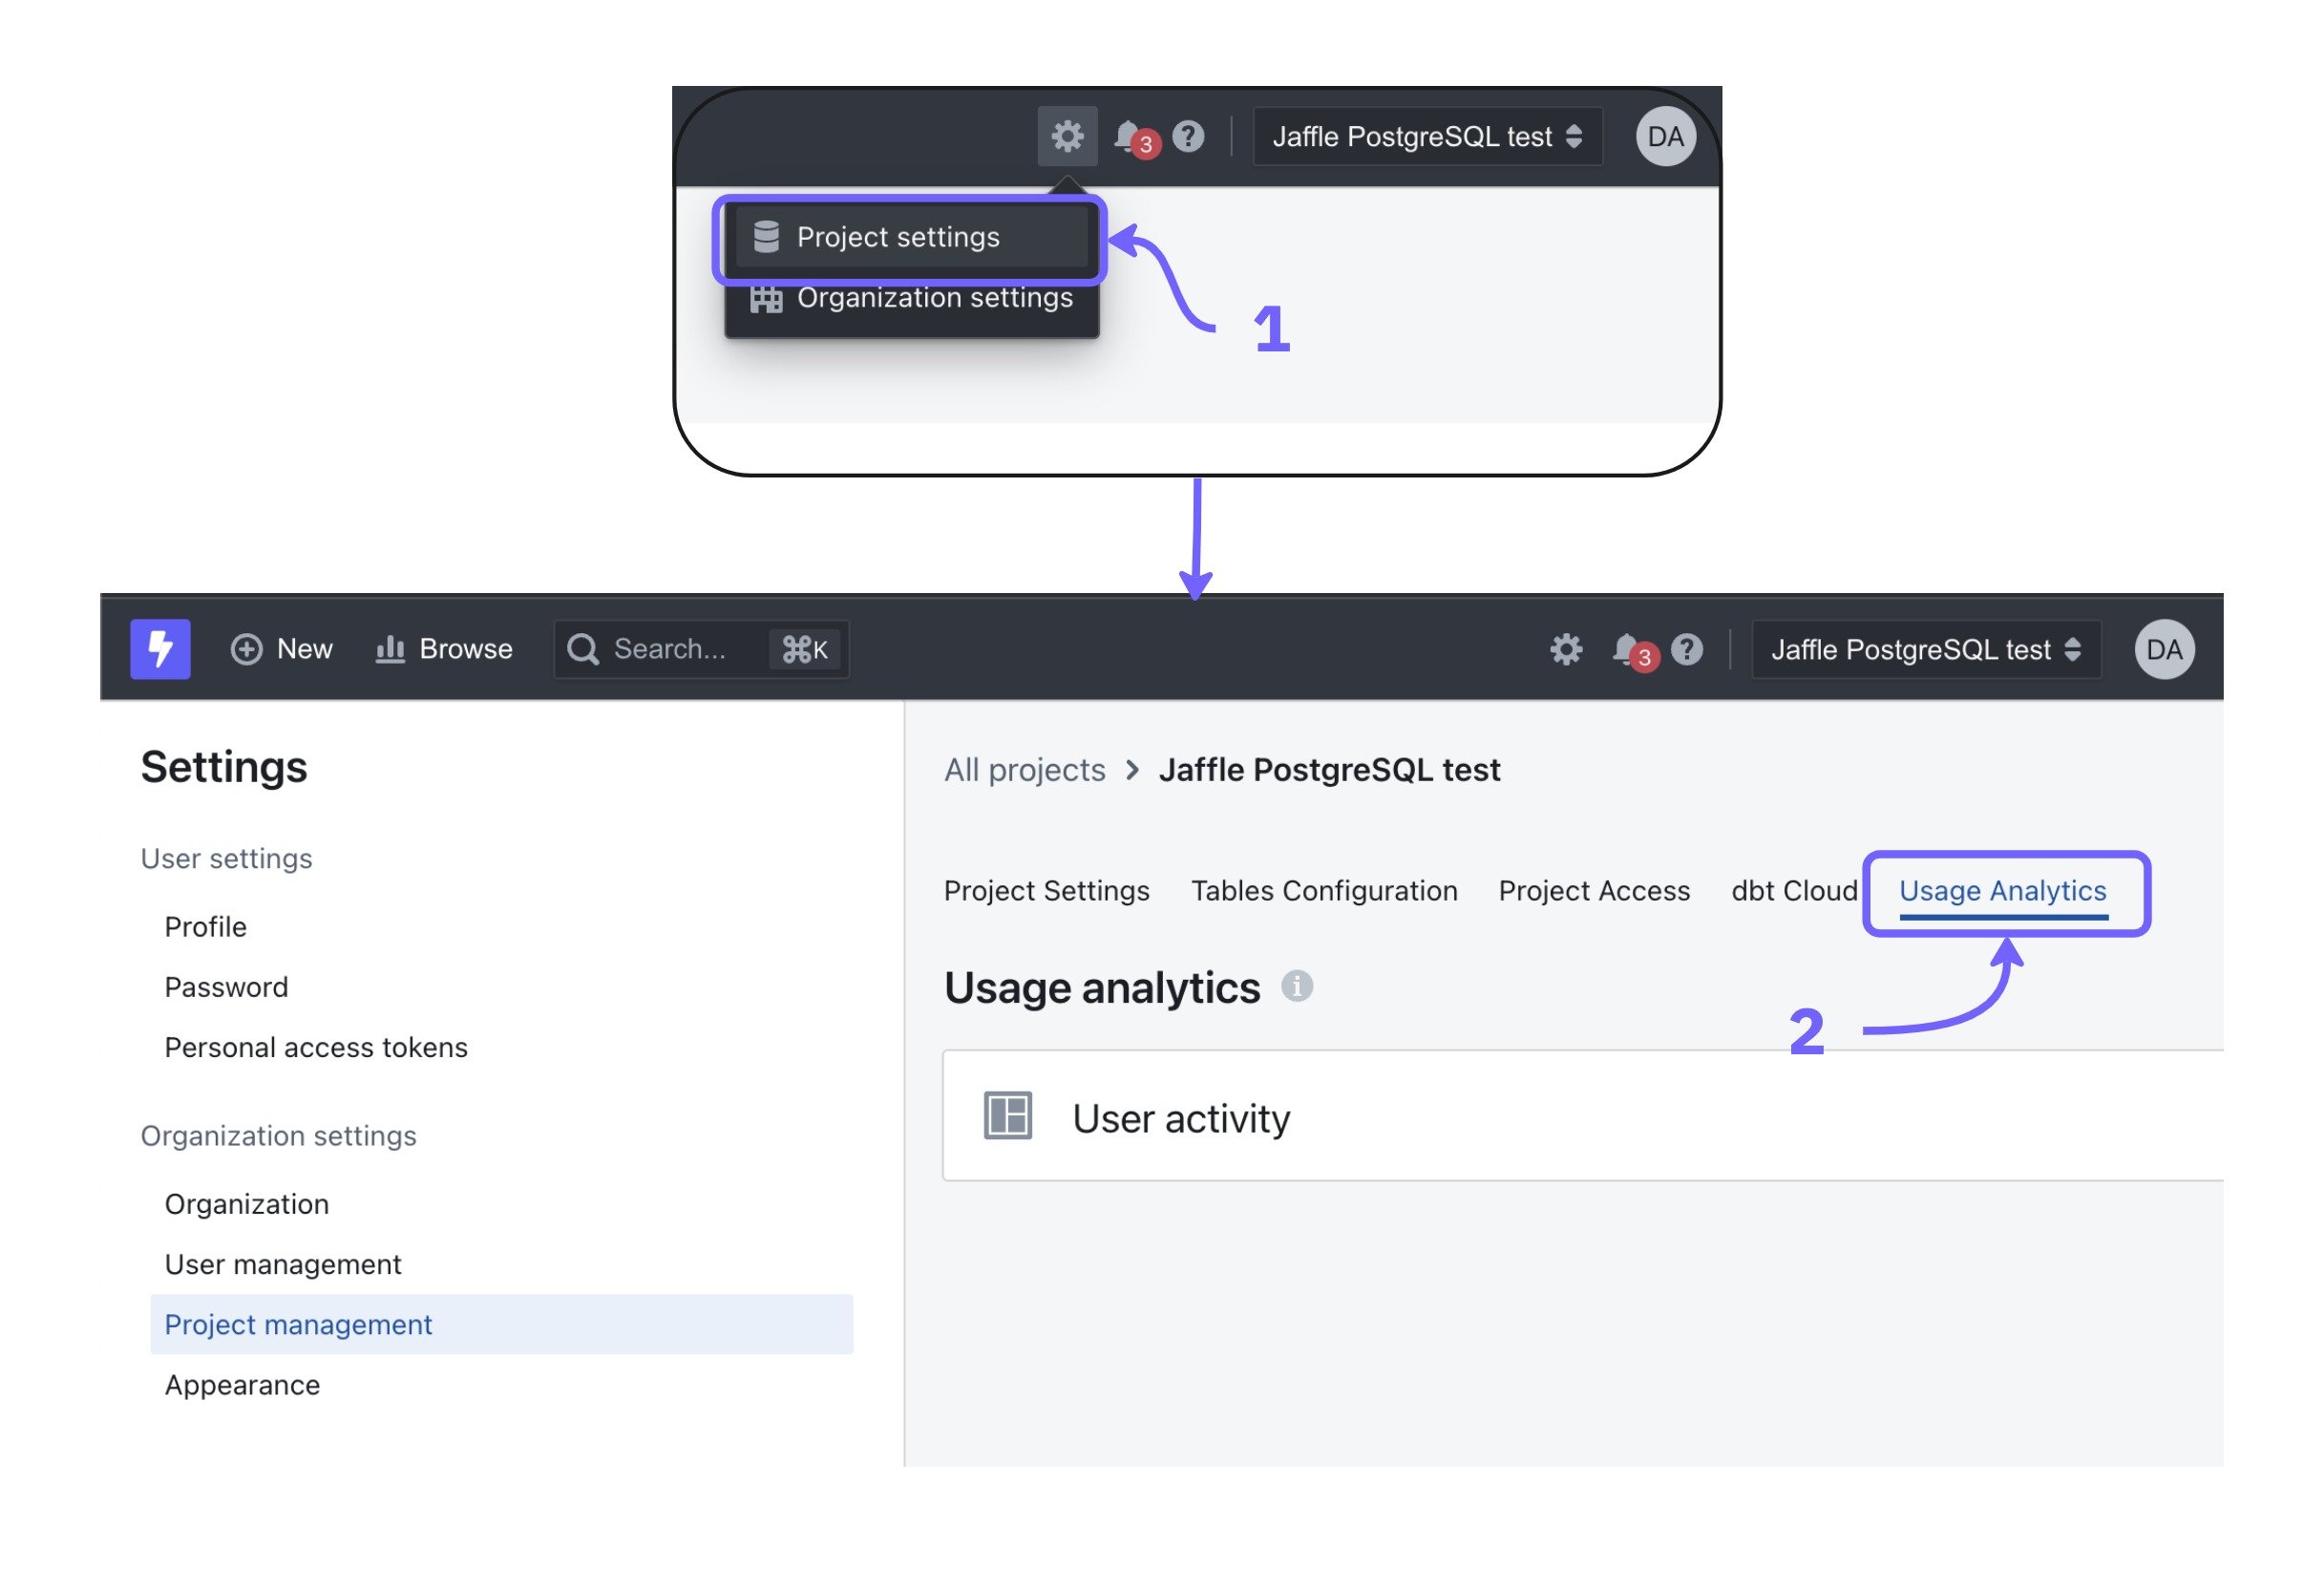
Each project has usage analytics dashboards created by Lightdash giving you an overview of your project’s content and user activity. To see your usage analytics dashboards for a project, just click on thesettings icon, project settings, then usage analytics.
User Activity dashboard
This dashboard gives you an overview of the users in your project and the activity of your users.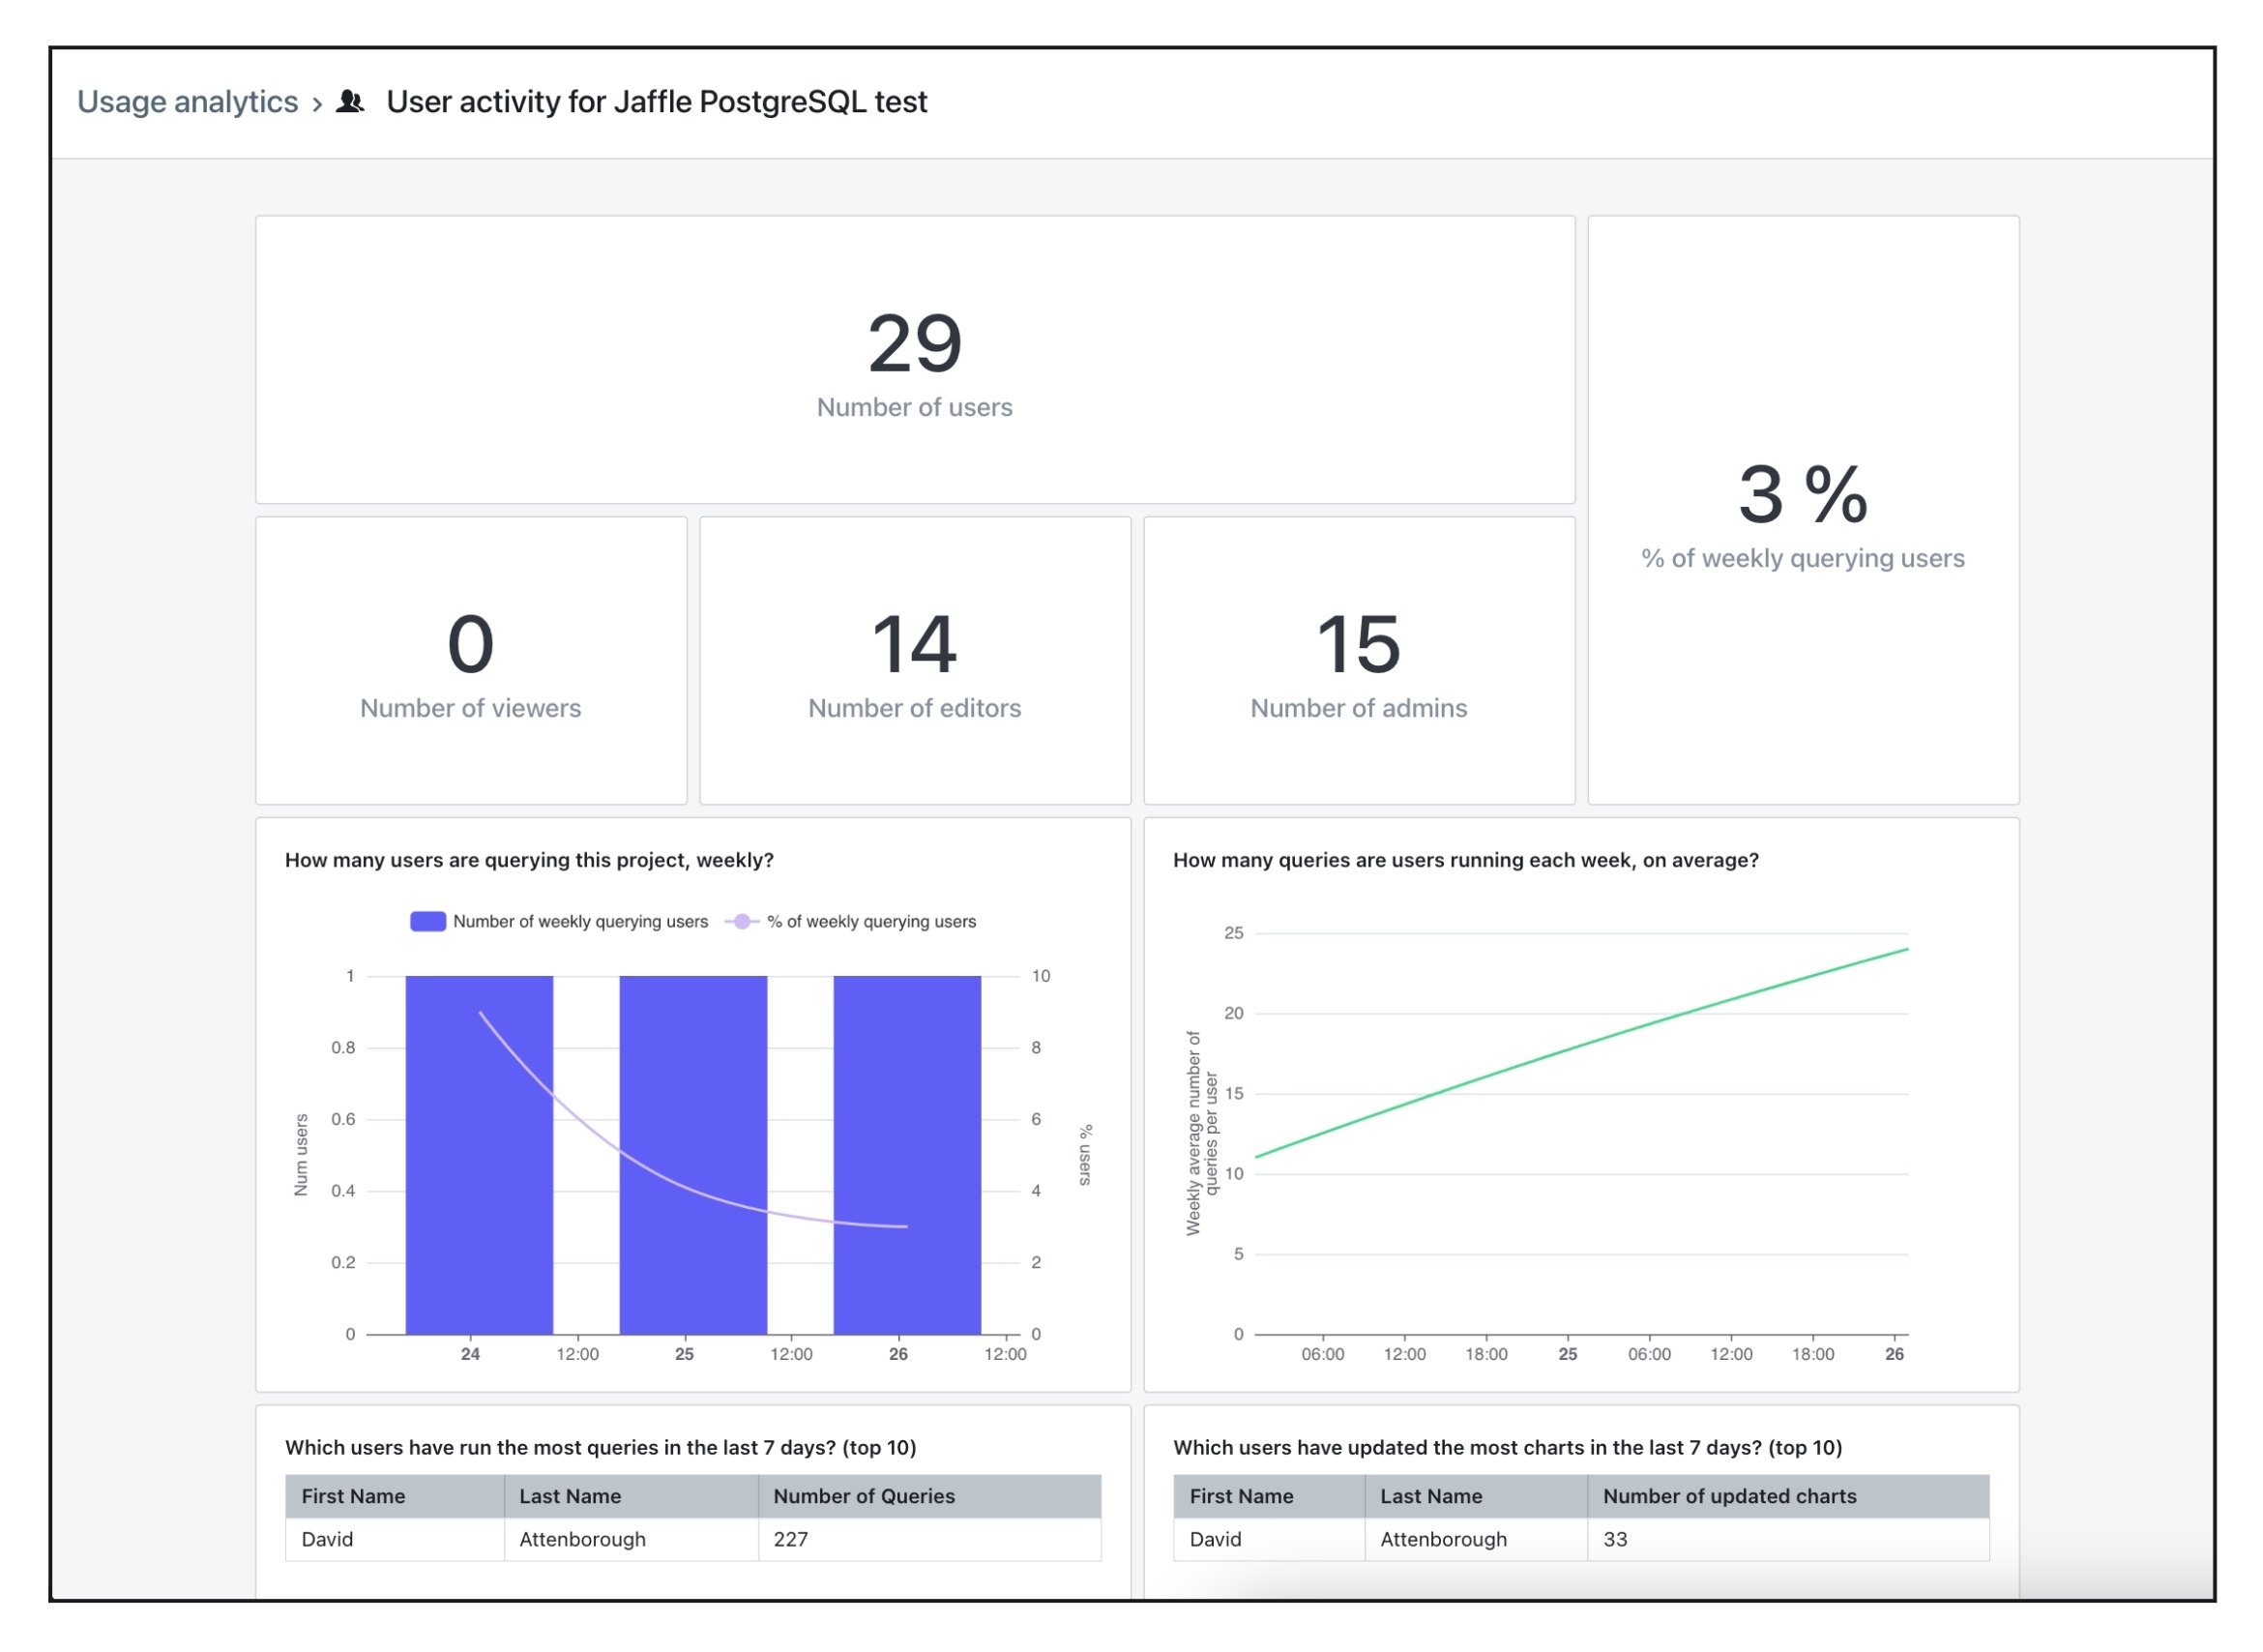
- Number of users: the total number of users that have access to the project.
- Number of viewers: the number of users with the
viewerrole that have access to the project. - Number of editors: the number of users with the
editorrole that have access to the project. - Number of admins: the number of users with the
adminrole that have access to the project. - % of weekly querying users: the % of users which have run at least one query in the project in the last 7 days (out of all users in your project). Queries include viewing existing charts and dashboards.
- Number of weekly querying users: the number of users which have run at least one query in the project in the last 7 days.
- Weekly average number of queries per user: the rolling 7 day average number of queries that each user is running in your project.
- Users that have run the most queries in the last 7 days: a list of the users that have run the most queries in your project in the last 7 days.
- Users that have updated the most charts in the last 7 days: a list of users that have updated (including created) the most charts in the project in the last 7 days.
- Users that have not run a query in the last 90 days: a list of users that have not run a query in the project in the last 7 days. This includes viewing charts and dashboards.
Extended usage analytics
Self-hosted instances can set theEXTENDED_USAGE_ANALYTICS=true environment variable to add two extra tables to the User Activity dashboard:
- Dashboard views (top 20): ranks dashboards in the project by total view count.
- Chart views (top 20): ranks charts in the project by total view count.
Query tags
Query tags are metadata which is added to your data warehouse queries and gives you information about each query executed. The following query tags are sent:| Query Tag | Detail |
|---|---|
| organization_uuid | Lightdash organization unique identifier. |
| project_uuid | Lightdash project unique identifier. |
| user_uuid | User unique identifier. |
| dashboard_uuid | Dashboard unique identifier. |
| chart_uuid | Chart unique identifier. |
| explore_name | Name of the explore. |
| query_context | Which context the query was executed in. For queries in: - dashboards use dashboardView - explore use exploreView- chart use chartView- sql chart use sqlChartView |
user_attribute_<name> | One tag per user attribute value assigned to the querying user. Applies to both regular users and embed viewers, and requires no configuration. |
User attribute tags
For every query, Lightdash emits an extrauser_attribute_<name> tag for each user attribute value assigned to the user running the query. This makes it possible to attribute warehouse cost, audit access, or debug row-level-security by user attribute directly from your warehouse’s query history.
- Tags are emitted alongside the standard query tags for both signed-in users and embed viewers (using the attributes passed on the embed token).
- Values are carried through async query execution end-to-end, so they appear on the actual warehouse job (for example, as labels on a BigQuery job).
- Keys and values are sanitized to match warehouse tag constraints — lower-cased, restricted to
a-z 0-9 _ -, and truncated if too long. Invalid or oversized metadata is sanitized rather than blocking the query. - No configuration is required — user attribute tags are emitted automatically wherever query tags are already supported.
region attribute set to emea and customer_tier set to enterprise will produce these additional tags on every warehouse query they trigger:
labels.user_attribute_region = "emea" in BigQuery) to break down usage or cost by user attribute.
Query tags are stored differently in each data warehouse:
| Data Warehouse | Query Tag |
|---|---|
| BigQuery | Writes metadata as labels in your job history. |
| Snowflake | Writes JSON metadata in the comment column of your query history. |
| ClickHouse | Writes JSON metadata in the comment column of your query log. |
| Trino | Sends metadata as comma-separated key=value pairs in the X-Trino-Client-Tags HTTP header on each submitted query. |
| Redshift | Appends JSON metadata as a SQL comment in each submitted SQL query. |
| Databricks | Appends JSON metadata as a SQL comment in each submitted SQL query. |
| Postgres | Appends JSON metadata as a SQL comment in each submitted SQL query. |
| Athena | Appends JSON metadata as a SQL comment in each submitted SQL query. |